Monthly reports
Monthly reports are available on the Pro and Ultra plans. Free and Basic users do not get monthly reports. See Plans and pricing.
On the 1st of each month (in your timezone), TellDone generates a long-form monthly report covering the previous month. Monthly reports are the most detailed report short of the yearly review.
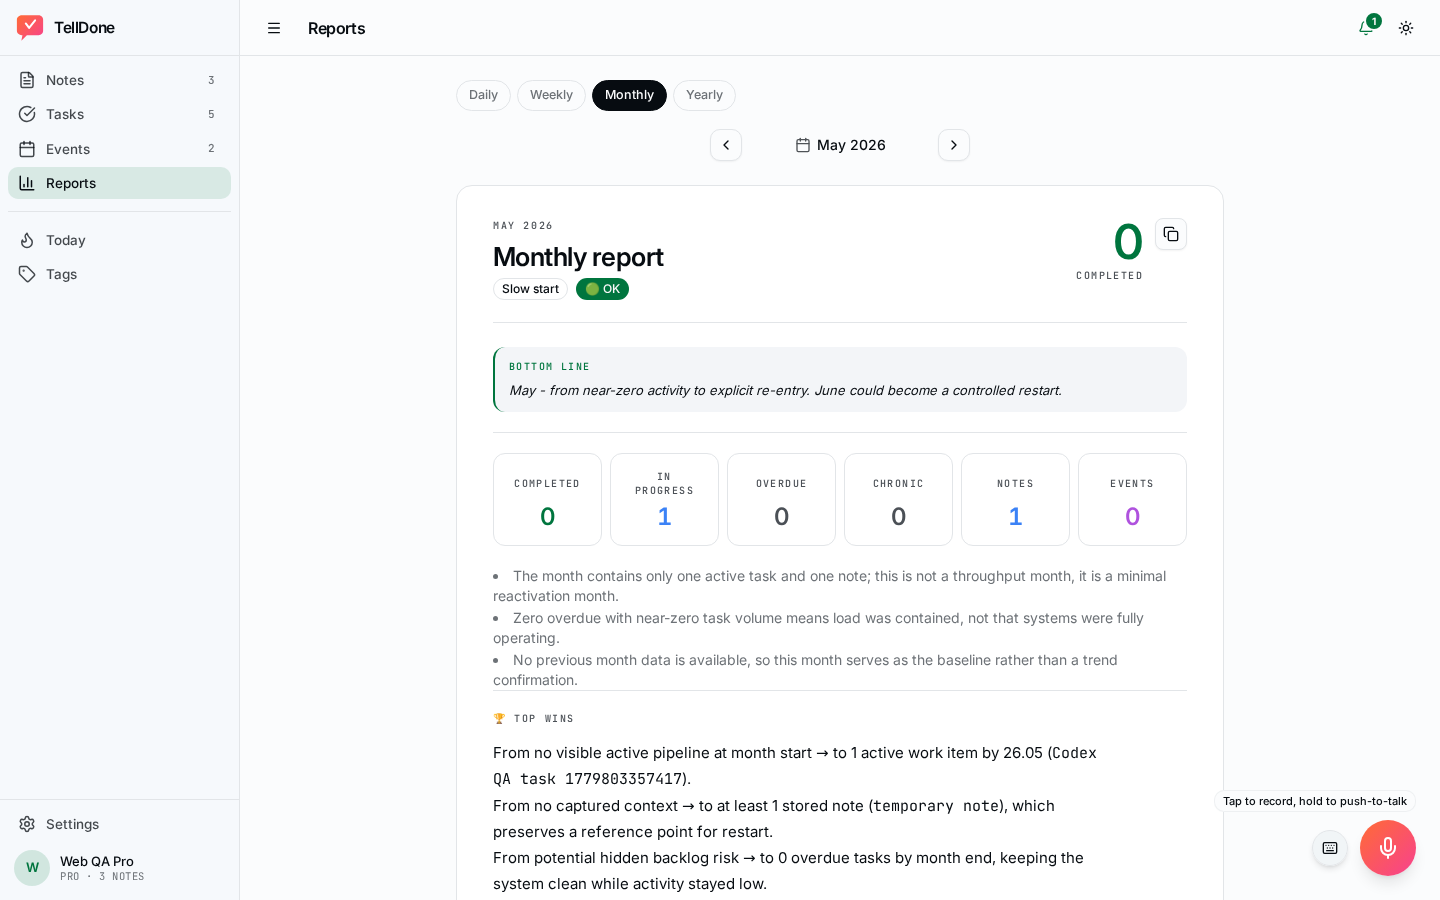
On the web app, the monthly report uses a 2x3 tile grid at the top:
Sections
- Executive Summary - top wins, main blocker, burnout status, focus for next month.
- Activity Overview - notes, tasks created and completed, events, and trends.
- Key Themes - the dominant topics and projects from the month.
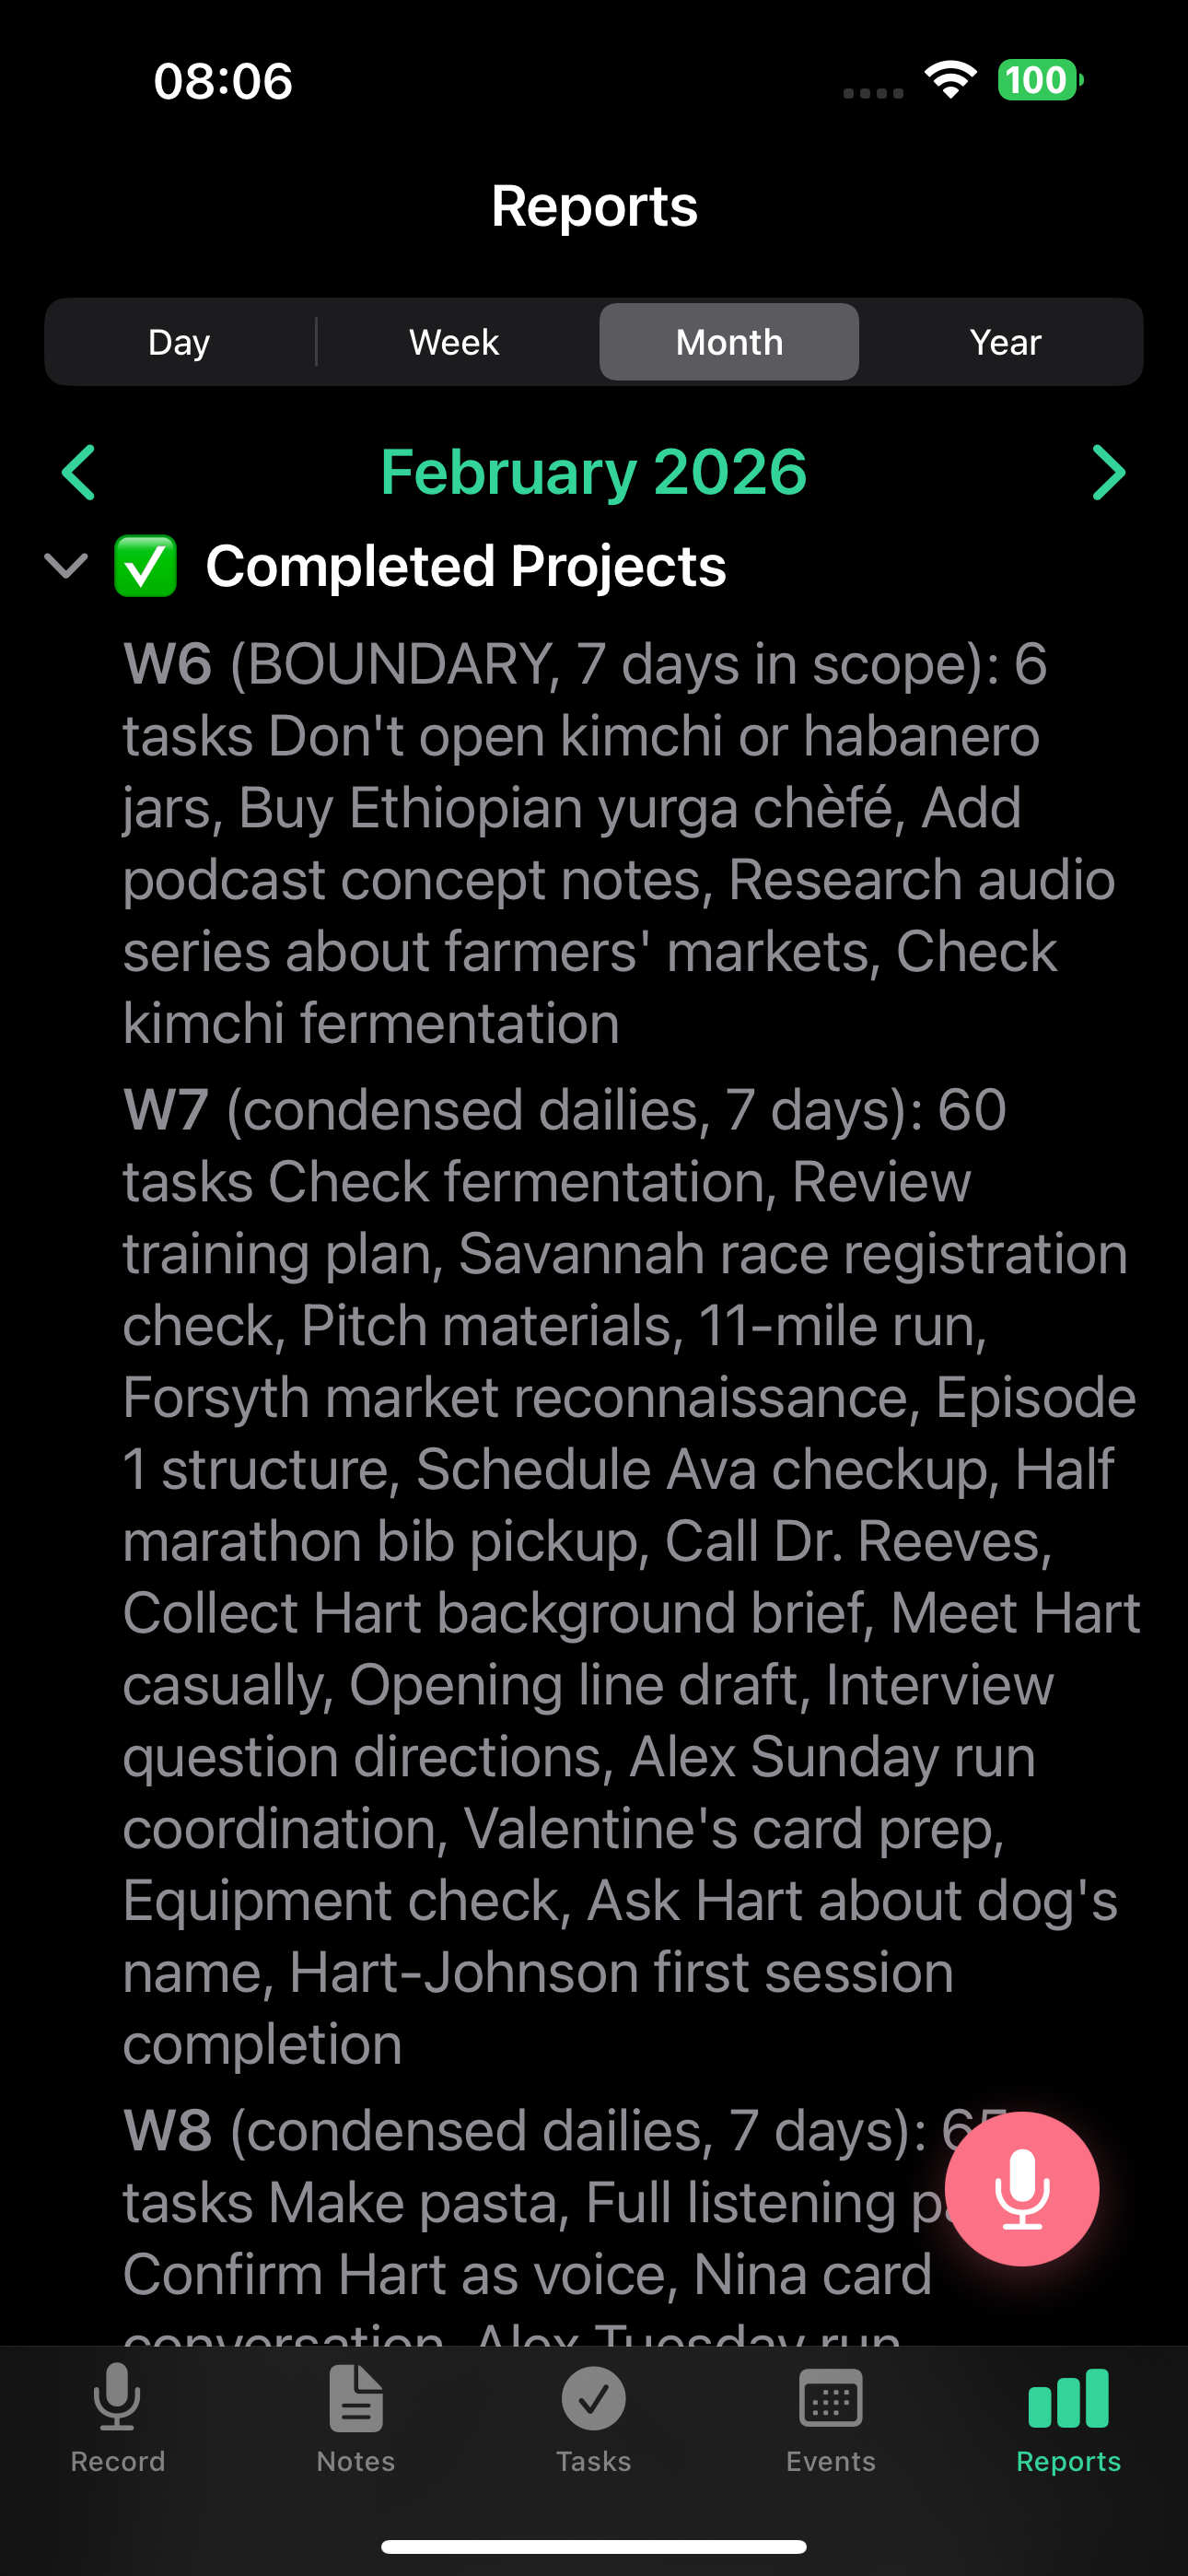
- Notable Achievements - completed projects and milestones worth celebrating.
- Patterns and Insights - chronic issues, correlations, leading indicators, 80/20 analysis.
- Tag Analysis - top tags and how they shifted across weeks.
- Looking Forward - recommended focus and ideas for the coming month.
Executive summary in detail
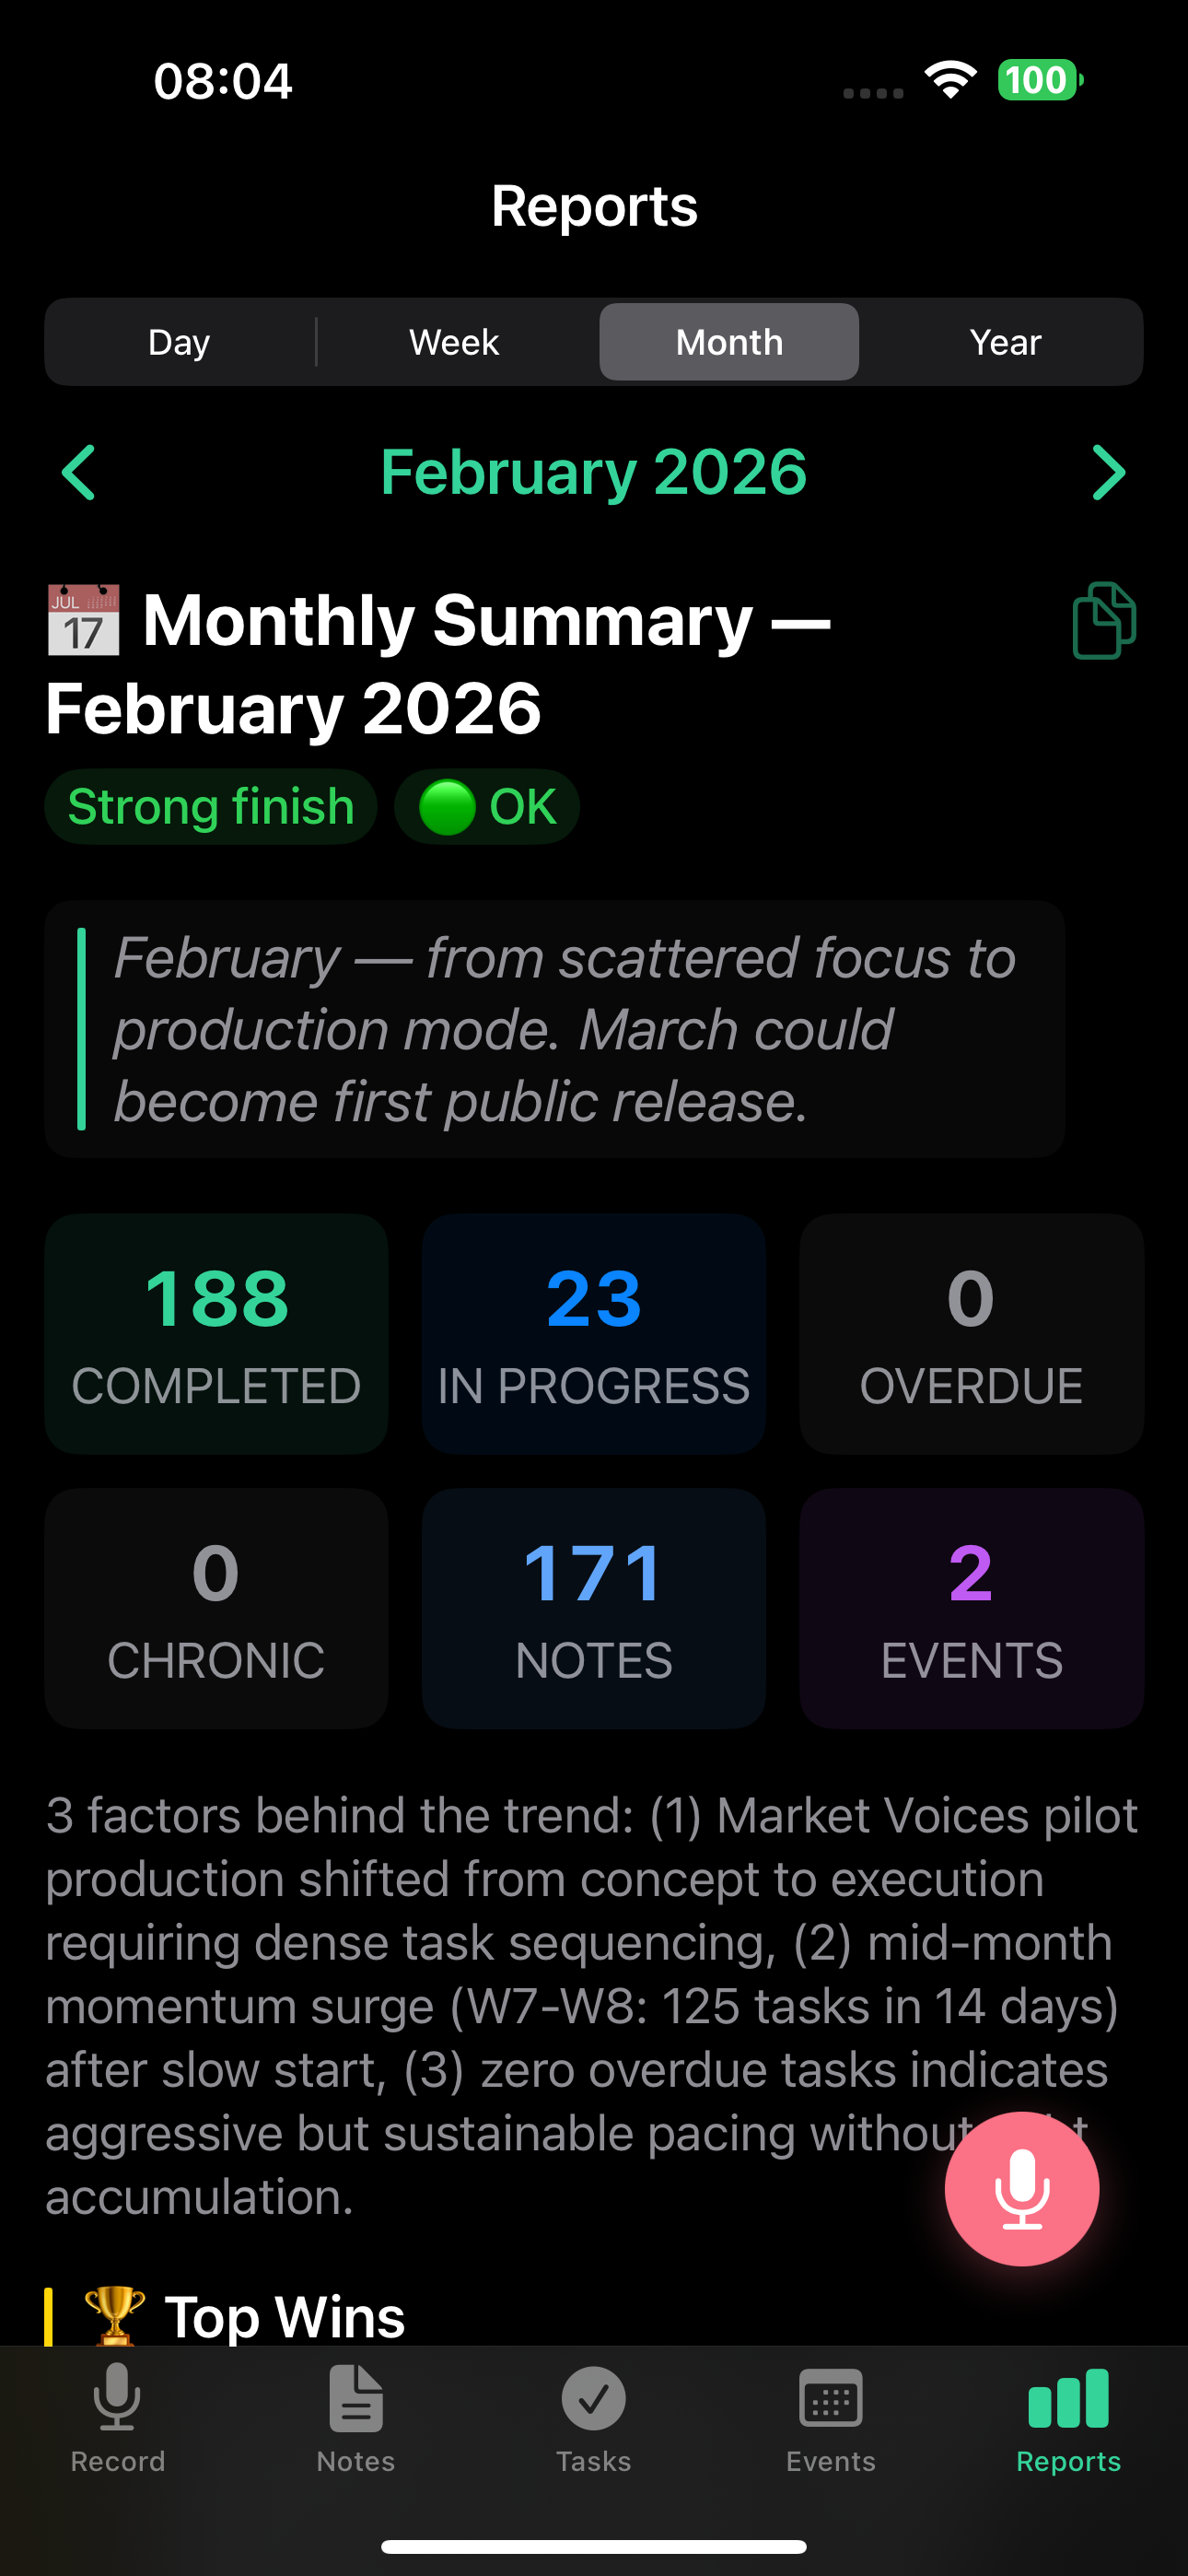
- BLUF (Bottom Line Up Front) - one sentence that captures the month's trajectory and what next month could become. Designed for a 15-second scan.
- Key Metrics - tasks completed, notes, events, and other headline numbers with a per-working-day breakdown, a trend arrow, and a comparison to the previous month.
- Top Wins - your three biggest achievements of the month, each framed as "from [state at start] to [state at end]".
- Main Blocker - the biggest obstacle you faced, with its age in days, root cause, and a concrete "if this, then that" action with a deadline.
- Burnout indicator - a five-signal checklist that measures your work patterns (overdue tasks growing for 3+ weeks, task deferral rate above 30%, completion rate dropping, voice note frequency decreasing, gaps in daily report generation):
- Green (OK) - 0-1 signals triggered, healthy pace, keep going
- Yellow (Watch) - 2-3 signals triggered, showing signs of strain, consider slowing down
- Red (Alert) - 4-5 signals triggered, risk of burnout detected, take action
- Focus for Next Month - recommended priority for the coming month.
Patterns, insights, and projects
- Month Narrative - the full story of your month
- Chronic Issues - tasks or problems that have been pending for more than 14 days, with root-cause analysis and recommendations to resolve them. Anything that has been hanging for more than 90 days is flagged with a suggestion to delete it
- Patterns and Correlations - connections between your activities
- Areas of Responsibility - breakdown by life and work areas
- Leading Indicators - early signals of emerging trends
- 80/20 Analysis - which 20% of activities produced 80% of your results
- Top-5 Tags - your most active categories
- Ideas - creative suggestions generated by AI
- Completed Projects - major accomplishments worth celebrating
Monthly metrics
- Total notes, tasks created and completed, events
- Comparison with the previous month
- Trend indicators showing whether you are improving
Viewing monthly reports on the web app and iPhone
Monthly reports use the V2 structured rendering with a dedicated "monthly view" on both app.telldone.app and the iOS app:
- Metric tiles - a 2x3 grid (6 tiles): completed tasks, in-progress tasks, overdue tasks (top row); chronic tasks, notes count, events count (bottom row). Chronic tasks are highlighted in yellow when the count exceeds 20.
- Executive summary card with top wins, main blocker, and burnout status.
- Narrative sections for the full month story.
- Collapsible blocks for chronic issues, patterns, completed projects, top tags, and ideas.
- Timelines and links to the underlying notes, tasks, and events that built each section.
- Period navigator - use previous and next buttons to move between completed months, or open the month picker to jump anywhere.
- The copy button (clipboard icon) copies the full report to your clipboard, ready to paste into a doc, an email, or another app.
- Auto-refresh - when a new monthly report is generated, the screen refreshes automatically over a WebSocket connection.
- "Up next" placeholder - if you open the current (in-progress) month, you see an "Up next" placeholder. The report appears on the 1st of the next month.
Long monthly reports load progressively in the browser, so you can start reading the executive summary while later sections finish rendering.
Report language
Monthly reports are generated in your content language (the language you speak), not your UI language. Section headings and email subjects stay in your UI language; the body text is in your content language.
Pay attention to the burnout indicator. It checks five concrete signals in your work patterns. A yellow (2-3 signals) or red (4-5 signals) result is an early warning - do not ignore it.
See also
- Daily reports - daily data that feeds the monthly analysis
- Weekly reports - weekly insights that shape the monthly story
- Yearly reports - annual review built from monthly reports
- Email reports - get monthly reports in your inbox
- Smart Context - achievements tracked across the month